

Cosmographer Questions
 Calibre
🖼️ 39 images Mapmaker
Calibre
🖼️ 39 images Mapmaker
Hey all,
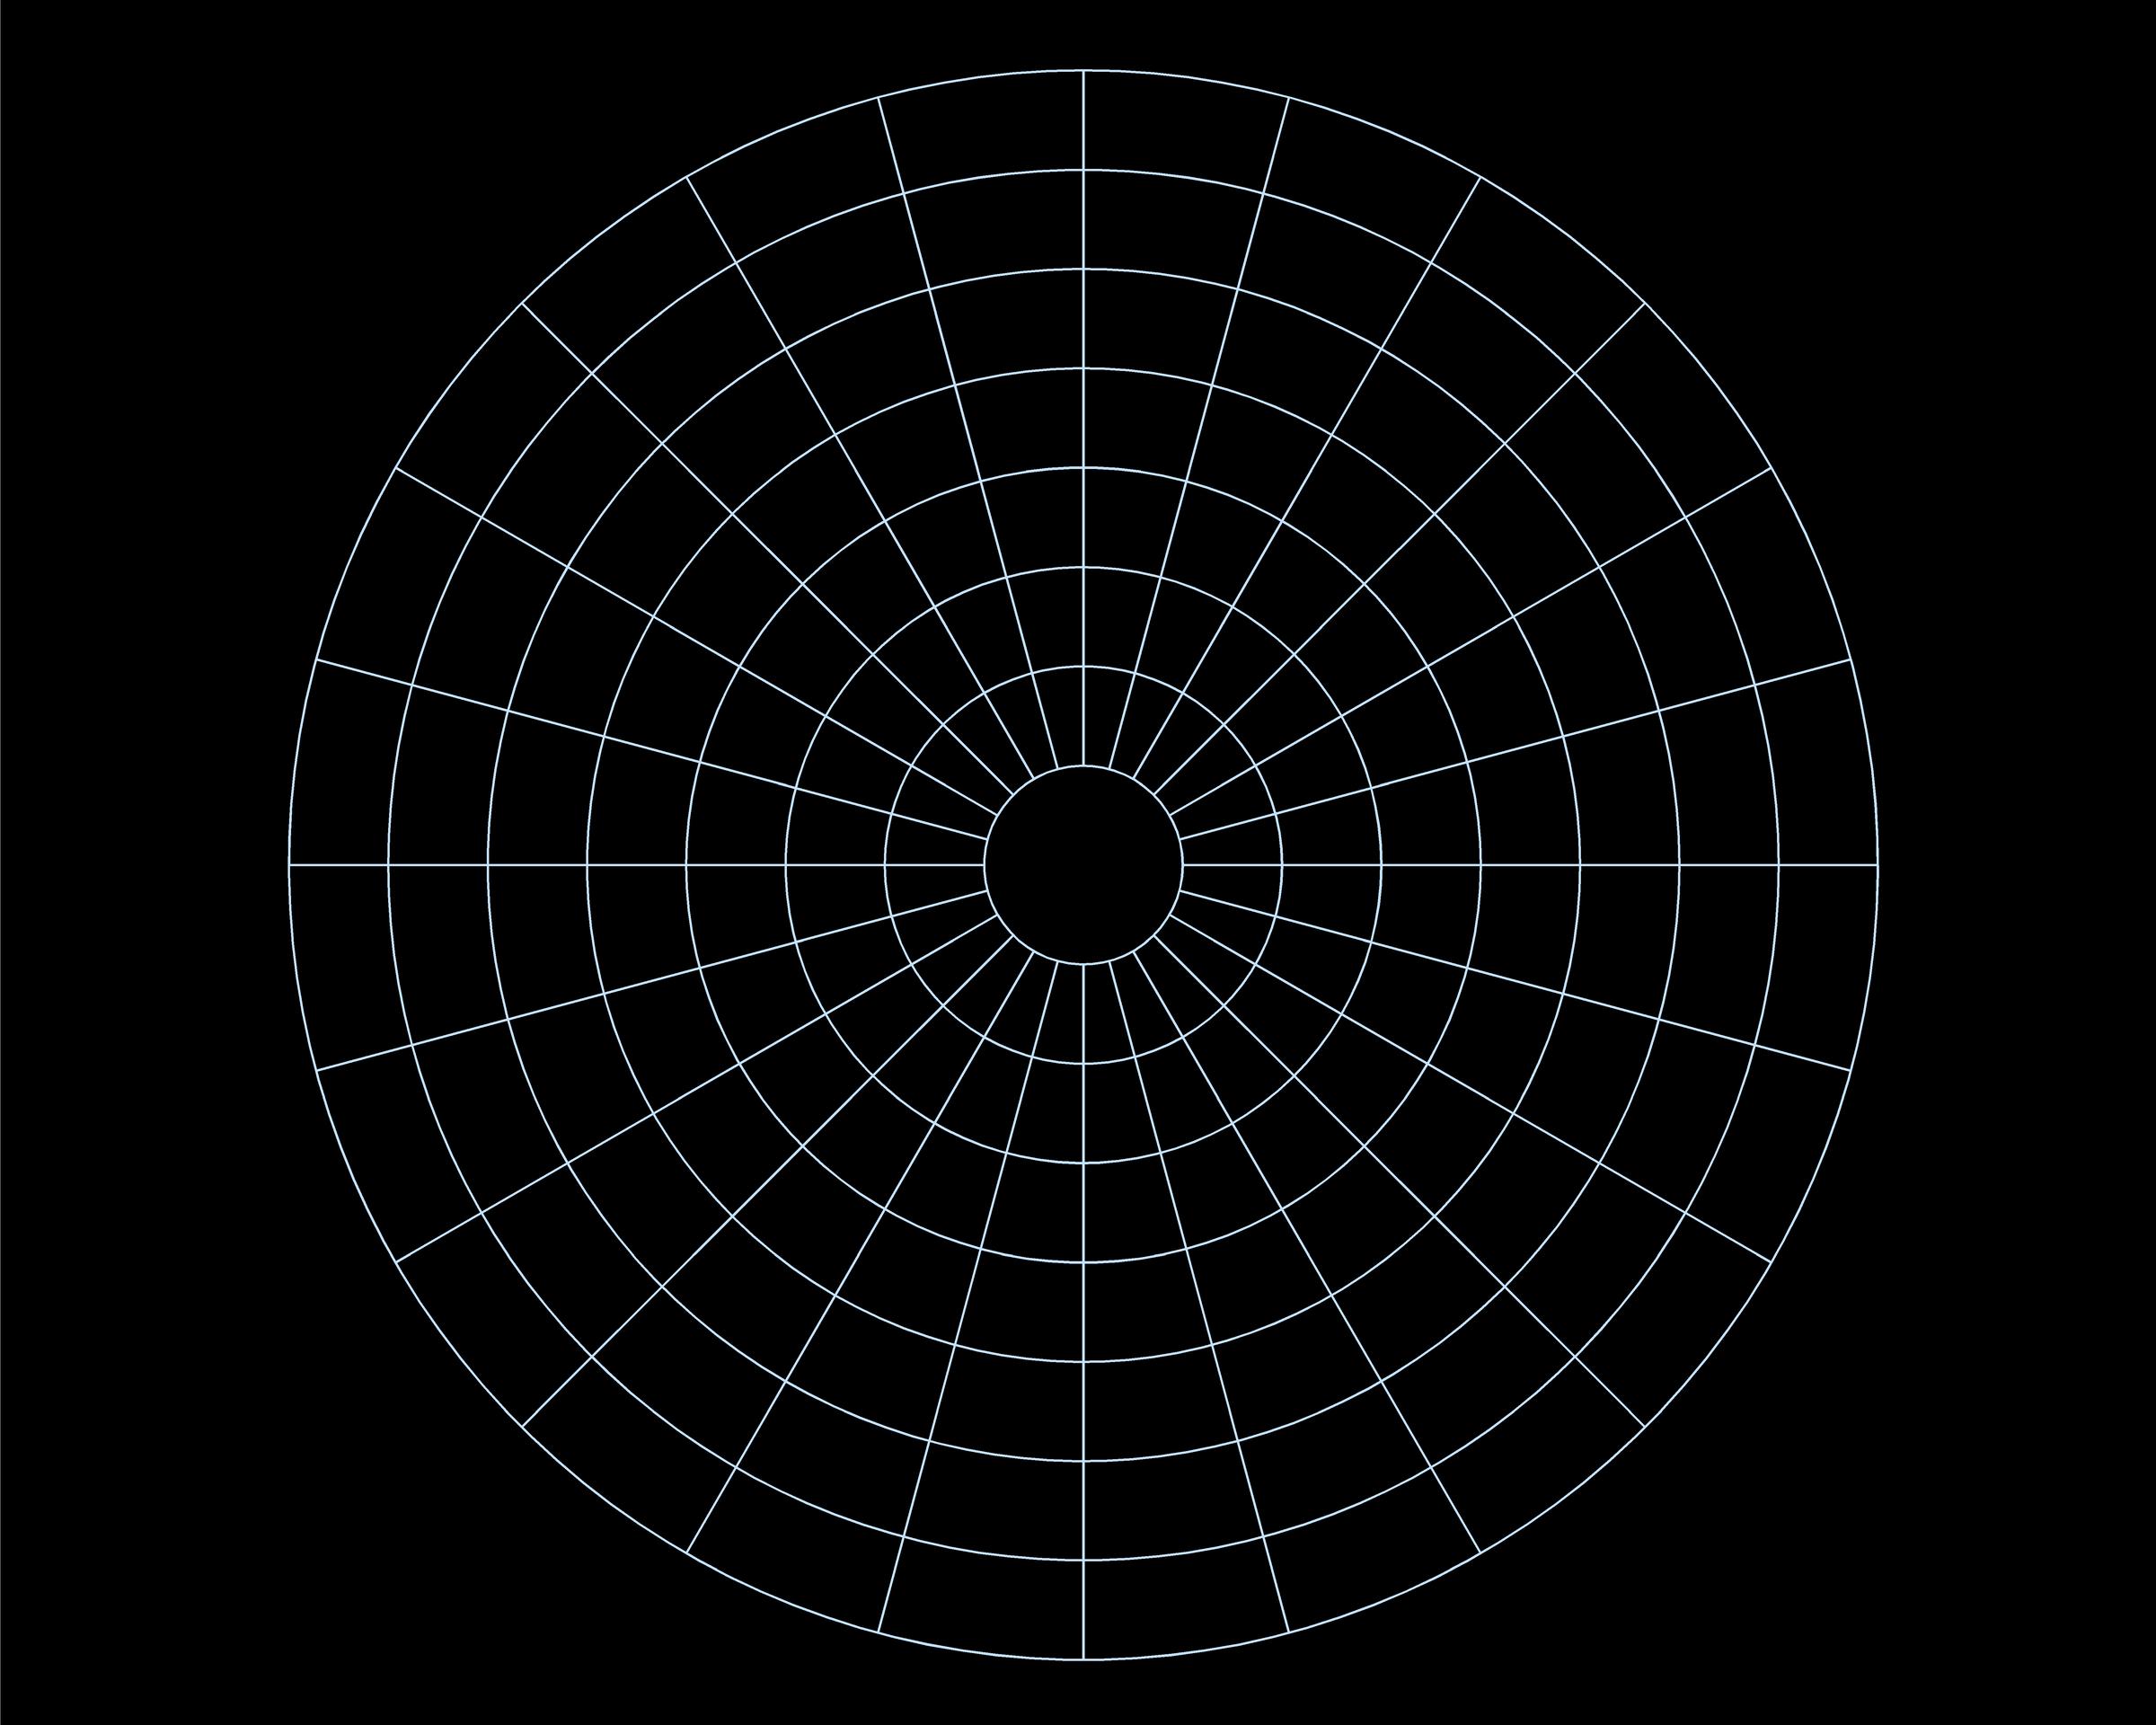
Please note the galactic grid below:
1: How was this drawn, please? The outermost circle is a 2d polygon, while all other circles are 2d circles. The lines are 2d paths. I can find no way to convert a circle into a path as it ignores all explode actions/commands.
2: Is there somewhere in cosmographer where I can find a blank template of this galactic grid? I've copied one out as you see, but now I'm trying to figure out (reading the Tome) how the paths were set at precise degrees around the inner circle, how the numbers were set precisely around the outer polygon, and other issues. For example, how were the circles placed concentrically? The 'center' modifier is haphazard at best--sometimes works, sometimes doesn't.
Was this drawn in another program, inserted and traced, perhaps? I don't see how that could work...but, no idea.
Can help?
Thanks indeed
Cal
Comments
Oh, I see I removed the numbers. Basically, along the inner circumference of the outer circle, numbers incremented by 15 degrees are set precisely, bisected by the radial lines.
Sorry bout that
Cal
1. To get a circle into a path/poly, first Split it, then use line to path on it.
2. I don't think there is a template with this grid, this was drawn specifically for that map. If you have the 2018 annual, there is a star charts issue which includes a similar grid in the template, if not this exact one.
Placing circles concentrically can be done a bunch of ways. Either with the center modifier (I don't understand why you find it unreliable, it always works for me for normal entities. I don't know if it correctly handles things like multipolies, and it can't handle symbols correctly which are complex entities made up from several others.), or by using snap and using a common center point, or by just typing in the coordinates for the center of each circle (and make them the same obviously), or even by placing another entity first and use for example endpoint. To make the sizes of the circles increase linearly, either use snaps, or type in the radius manually, increasing it by the desired number for each circle.
Lines can be easily drawn using radial coordinates. Draw them from the center first, then trim them to the inner circle. You can also use array copy to distribute them around a circle, or even Symbols along.
The numbers are just text with a rotation matching the angle of the line + 90, with a low center as text justifciation, and placed using the endpoint modifer.
It might not be a simple one-click solution, but with all the precision tools in CC3+, drawing grids like this is one of the things it excels at.
The Cartographer's Annual star charts graticule started life as described in this Forum topic from 2018. There are several links to find similar graticules from that topic if you don't want to draw your own. CA34 from 2009 October has one, for instance, and long-time Forum correspondent @JimP has done work on the subject too, culminating in Bill Roach producing some templates available for free download from Jim's Crest of a Star website - zip file is on this page.
Outstanding. Saved me from trying to look that up. I knew I had it somewhere... somewhere.
Helps it was connected with something I'd been looking at for decades prior to the eventual realisation of those star charts, Jim! Tends to stick in the mind a bit more ?
Thanks for the zip, Wyvern - there are some nice png's there