Using real world data
 Joachim de Ravenbel
Surveyor
Hi all,
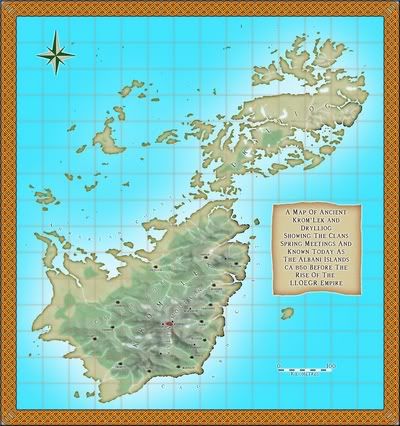
I had that weird idea to use some real world data (included on the FT CD) to create this new map (click to zoom):

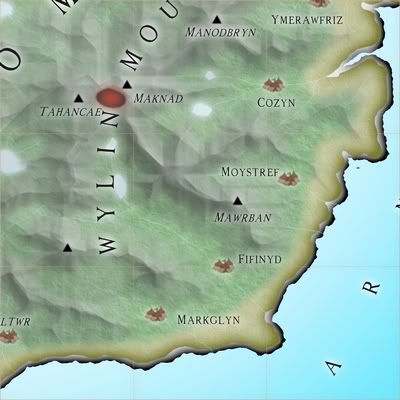
Zoomed region:

I raised the sea level and exported every 250 ft contour line to CC. I had to edit a bit the lower contours and got my coast and mountains.
What do you think ?
Because I used my own region, it gives me the advantage of being quite familiar with the terrain and if I need a more precise map I can always rely on commercial road maps.
I had that weird idea to use some real world data (included on the FT CD) to create this new map (click to zoom):

Zoomed region:

I raised the sea level and exported every 250 ft contour line to CC. I had to edit a bit the lower contours and got my coast and mountains.
What do you think ?
Because I used my own region, it gives me the advantage of being quite familiar with the terrain and if I need a more precise map I can always rely on commercial road maps.


Comments
First I had to find the right folder from the GTOPO30.zip.
It was the W020N90 that covers most of eastern Europe.
The data file is W020N90.DEM
To have accuracy, I modified the size using -25S to 175N and -80W to 80E instead of 40N-90N and -20W-20E.
I used then save as CC2 file, CREATE, Altitude Contours only and Advanced, next
Add multiple
Lowest 500 Highest 5000 Interval 250 Filled Match Altitude Contour Match Altitude NoLabel Next
Fine Multipoly Each Contour Level Next
No additionnal
Give the setting a name
EXPORT
Afterwards, only CC3 work.
Putting each multipoly on a separate sheet then exploding.
Creating a temporary map border centered on the part I wanted.
Editing... A lot of erasing.
All the levels were not necessary. At the end I only kept 6 (including the coast) but I choose the ones that gave me the best moutains shapes.
The colors are from CA28 with some editing for the land and forest.
Mountains are from CA24